Monday, October 20, 2014

Ocean Shores Real Estate ~ Third Quarter 2014 Review

Ocean Shores Real Estate ~ Third Quarter 2014 Review

Ocean Shores Real Estate ~ Third Quarter 2014 Review
 Capture
Greetings from the beach…
Sales are up and continuing to improve at the beach. Prices are still low, however, and they’ll likely stay that way until the foreclosures go away which should be very soon…. I hope.
 About OS
Ocean Shores Residential Sales
Home Sales are up over 28% so far this year!
Ocean Shores residential real estate sales are way up and inventory is decreasing. 76 homes sold last quarter compared to 63 in the second quarter. This has been the strongest quarter of residential sales that we have seen at the beach in a very long time. As it stands right now through three quarters, 193 homes have sold so far in Ocean Shores this year, compared to 150 last year during the same time period. That’s an increase of over 28% in home sales at the beach this year so far. The biggest problem, still, is the number of foreclosures on the market. Currently, just over 8% of all the homes on the market are foreclosures. Once this number gets lower, average prices will jump.
2014 Home Sales (3rd Quarter)
The average home that sold during 3rd quarter in Ocean Shores was 1,443 square feet and took 202 days to sell compared to 1,413 square feet and 285 days during the 2nd quarter. 12 of those homes sold were listed as “bank-owned.” Sellers last quarter on average received 95.54% of asking price ~  There are 237 homes on the market right now compared to 255 at the end of last quarter ~ Average of 243 days on market. One has been for sale for 3,349 days now (coming up on ten years now for this same house that’s in this report every quarter…) – not my listing, but, they did finally reduce the price… There were 42 Homes pending on October 1st compared to 32 on July 1st.
2014 Quarterly Home Sales
* 76 Homes Sold during 3rd Quarter 2014 ~ Average Sales Price $142,752 ~ Average of 202 Days on Market. Price Range: $20,000 – $395,000.
* 63 Homes Sold during 2nd Quarter 2014 ~ Average Sales Price $145,274 ~ Average of 285 Days on Market. Price Range: $30,000 – $368,950.
* 52 Homes Sold during 1st Quarter 2014 ~ Average Sales Price $156,384 ~ Average of 241 Days on Market. Price Range: $23,000 – $385,000.
* 49 Homes Sold during 4th Quarter 2013 ~ Average Sales Price: $153,136 ~ Average of 217 Days on Market. Price Range: $25,000 – $347,000.
* 70 Homes Sold during 3rd Quarter 2013 ~ Average Sales Price $141,161 ~ Average of 224 Days on Market. Price Range: $27,500 – $300,000.
* 42 Homes Sold during 2nd Quarter 2013 ~ Average Sales Price $151,355 ~ Average of 236 Days on Market. Price Range: $27,000 – $327,000.
Want to know what’s going on in the Ocean Shores Real Estate market more than once a quarter? Be a Fan & “Like” us at http://www.facebook.com/pages/Ocean-Shores-Real-Estate/42604953991. Thanks! By the way, the contents of this newsletter were posted on the Facebook page before you got this…
When it's time to sell or buy

Ocean Shores Condo Sales
The number of condo sales doubled in the third quarter from the second. There are only a very few Ocean View condos available that aren’t condotels.
2014 Condo Sales (3rd Quarter)The average condo that sold last quarter in Ocean Shores was 1028 square feet compared to 434 square feet the previous quarter. All four condos that sold last quarter were ocean front and all were down south near the North Jetty. There are 34 condos on the market (27 last quarter) for an average list price of $99,185. Seven condos were pending at the beginning of October (4 of those already sold as of 10/12).
2014 Quarterly Condo Sales* 4 Condos Sold during 3rd Quarter 2014 ~ Average Sales Price: $127,225 ~ Average of 353 Days on Market. Price Range: $85,000 – $172,500.
* 2 Condos Sold during 2nd Quarter 2014 ~ Average Sales Price: $35,000 ~ Average of 154 Days on Market. Price Range: $20,000 & $50,000.
* 4 Condos Sold during 1st Quarter 2014 ~ Average Sales Price: $98,625 ~ Average of 161 Days on Market. Price Range: $28,000 – $180,000.
* 1 Condo Sold during 4th Quarter 2013 ~ Sales Price: $130,000 ~ 166 Days on Market.
* 8 Condos Sold during 3rd Quarter 2013 ~ Average Sales Price: $132,488 ~ Average of 352 Days on Market. Price Range: $32,000 – $287,000.
* 5 Condos Sold during 2nd Quarter 2013 ~ Average Sales Price: $125,590 ~ Average of 225 Days on Market. Price Range: $50,000 – $215,000.
Ocean Shores Vacant Lot SalesLot sales are up over 8% so far this year over last.
69 Lots sold last quarter compared to only 42 the previous quarter. Average sales prices are way down due to the number of lots selling for under $10,000. Thirty-one of the 69 lot sales sold for $10,000 or less. The most expensive lot sale was a gorgeous lake lot that sold for $78,000.
Copy of The North Beach (2) (1)

2014 Vacant Lot Sales (3rd Quarter)Twenty lots were pending on October 1st. There are 559 (506 last quarter) lots on the market right now for an average list price of $45,409. The City recently put nearly 200 foreclosure lots on the market. All LID’s are paid on these lots. If you would like the list of foreclosure lots, just reply to this email asking for the list. Thanks.
2014 Quarterly Vacant Lot Sales
* 69 Lots Sold during 3rd Quarter 2014 ~ Average Sales Price: $16,307 ~ Average of 259 Days on Market. Price Range: $4,000 – $78,000.
* 42 Lots Sold during 2nd Quarter 2014 ~ Average Sales Price: $25,127 ~ Average of 227 Days on Market. Price Range: $3,000 – $265,000 (triple lot on the water).
* 35 Lots Sold during 1st Quarter 2014 ~ Average Sales Price: $22,732 ~ Average of 367 Days on Market. Price Range: $3.000 – $140,000.
* 41 Lots Sold during 4th Quarter 2013 ~ Average Sales Price: $15,495 ~ Average of 318 Days on Market. Price Range: $800 – $50,000.
* 53 Lots Sold during 3rd Quarter 2013 ~ Average Sales Price: $22,517 ~ Average of 378 Days on Market. Price Range: $5,000 – $150,000.
* 53 Lots Sold during 2nd Quarter 2013 ~ Average Sales Price: $18,597 ~ Average of 247 Days on Market. Price Range: $5,000 – $85,000.
filename_01
Upcoming Things to Do in Ocean Shores
Click the picture for something to do every day in Ocean Shores & Grays Harbor
Life’s @ the Beach!
Jeff Daniel              
Managing Broker
John L. Scott Ocean Shores
Cell Phone: 360.581.9020711 Point Brown Ave NW
Ocean Shores, WA 98569
360.289.2454 (fax)

Monday, July 14, 2014

Ocean Shores Real Estate ~ Second Quarter 2014 Review

Ocean Shores Real Estate ~ Second Quarter 2014 Review

Ocean Shores Real Estate ~ Second Quarter 2014 Review

Image
Greetings from the beach…
Sales are still up at the beach. Residential home sales increased this past quarter as did vacant lot sales. Condo sales are down though and really slow. While the real estate market is slowly and steadily improving, we’ve still got a long way to go before I’ll call it good.
 Image
Ocean Shores Residential SalesOcean Shores residential real estate sales are still increasing even though inventory is on the rise. 63 homes sold last quarter compared to 52 in the first quarter. This has been the strongest quarter of residential sales that we’ve seen at the beach in a long time. Home prices dipped a bit from the previous quarter but that was due to quite a few low end sales dipping the average prices down. The average home sale was $145,274 compared to $156,384 in the first quarter. The most expensive home to sell so far this year was $368,950 which was a very nice, newer bay front home. 13 out of the 63 home sales were foreclosures this past quarter.
2014 Home Sales (2nd Quarter)The average home that sold during 2nd quarter in Ocean Shores was 1,413 square feet and took 285 days to sell compared to 1,498 square feet and 241 days during the 1st quarter. There are only 255 homes on the market right now compared to 217 at the end of last quarter and 261 last year at this time. 13 of those are listed as “bank-owned.” Average list price: $206,365 ~ Average of 240 days on market. One has been for sale for 3,246 days now (coming up on ten years now for this same house that’s in this report every quarter…) – not my listing… There were 32 Homes pending on July 1st compared to 35 Homes pending on April 1st, 2014.
2014 Quarterly Home Sales* 63 Homes Sold during 2nd Quarter 2014 ~ Average Sales Price $145,274 ~ Average of 285 Days on Market. Price Range: $30,000 – $368,950.
* 52 Homes Sold during 1st Quarter 2014 ~ Average Sales Price $156,384 ~ Average of 241 Days on Market. Price Range: $23,000 – $385,000.
* 49 Homes Sold during 4th Quarter 2013 ~ Average Sales Price: $153,136 ~ Average of 217 Days on Market. Price Range: $25,000 – $347,000.
* 70 Homes Sold during 3rd Quarter 2013 ~ Average Sales Price $141,161 ~ Average of 224 Days on Market. Price Range: $27,500 – $300,000.
* 42 Homes Sold during 2nd Quarter 2013 ~ Average Sales Price $151,355 ~ Average of 236 Days on Market. Price Range: $27,000 – $327,000.  Image
Want to know what’s going on in the Ocean Shores Real Estate market more than once a quarter? Be a Fan & “Like” us at http://www.facebook.com/pages/Ocean-Shores-Real-Estate/42604953991. Thanks! By the way, the contents of this newsletter were posted on the Facebook page before you got this…
Ocean Shores Condo SalesFour Condos sold during 1st quarter compared to five in the same quarter during 2013. Condo inventory and prices are way down. The most expensive condo on the market right now is $164,900. There are only a few Ocean View condos available.
2014 Condo Sales (2nd Quarter)The average condo that sold last quarter in Ocean Shores was 434 square feet and took 154 days to sell. These were two tiny non-view, non-waterfront condos – both in downtown. There are 34 condos on the market (27 last quarter) for an average list price of $99,185. Two condos are currently pending – one is listed at $35,000 and the other is an ocean front at $279,000.
2014 Quarterly Condo Sales* 2 Condos Sold during 2nd Quarter 2014 ~ Average Sales Price: $35,000 ~ Average of 154 Days on Market. Price Range: $20,000 & $50,000.
* 4 Condos Sold during 1st Quarter 2014 ~ Average Sales Price: $98,625 ~ Average of 161 Days on Market. Price Range: $28,000 – $180,000.
* 1 Condo Sold during 4th Quarter 2013 ~ Sales Price: $130,000 ~ 166 Days on Market.
* 8 Condos Sold during 3rd Quarter 2013 ~ Average Sales Price: $132,488 ~ Average of 352 Days on Market. Price Range: $32,000 – $287,000.
* 5 Condos Sold during 2nd Quarter 2013 ~ Average Sales Price: $125,590 ~ Average of 225 Days on Market. Price Range: $50,000 – $215,000.
Ocean Shores Vacant Lot SalesVacant land sales increased a bit this past quarter compared to the first. The number of sales increased from 35 to 42 this quarter while the average price also increased from $22,732 to $25,127. Sixteen of the 42 lots sold were sold for $10,000 or less. There are 90 (61 last quarter) lots listed for $10,000 or less currently…
2014 Vacant Lot Sales (2nd Quarter)There are 506 (440 last quarter) lots on the market right now for an average list price of $45,409. There are 15 (14 last quarter) lots currently pending. It took 227 days to sell a vacant lot compared to 367 last quarter.
2014 Quarterly Vacant Lot Sales* 42 Lots Sold during 2nd Quarter 2014 ~ Average Sales Price: $25,127 ~ Average of 227 Days on Market. Price Range: $3,000 – $265,000 (triple lot on the water).
* 35 Lots Sold during 1st Quarter 2014 ~ Average Sales Price: $22,732 ~ Average of 367 Days on Market. Price Range: $3.000 – $140,000.
* 41 Lots Sold during 4th Quarter 2013 ~ Average Sales Price: $15,495 ~ Average of 318 Days on Market. Price Range: $800 – $50,000.
* 53 Lots Sold during 3rd Quarter 2013 ~ Average Sales Price: $22,517 ~ Average of 378 Days on Market. Price Range: $5,000 – $150,000.
* 53 Lots Sold during 2nd Quarter 2013 ~ Average Sales Price: $18,597 ~ Average of 247 Days on Market. Price Range: $5,000 – $85,000.Image
cityofoceanshores.com Update
www.cityofoceanshores.com has been completely overhauled, update and is pretty cool. Please check it out. Thank you!
Image
Upcoming Things to Do in Ocean Shores
Click the picture for something to do every day in Ocean Shores & Grays Harbor
Life’s @ the Beach!
Jeff Daniel              
Managing Broker
John L. Scott Ocean Shores
Cell Phone: 360.581.9020711 Point Brown Ave NW
Ocean Shores, WA 98569
360.289.2454 (fax)
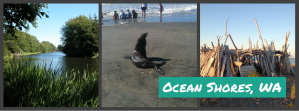
Wednesday, April 16, 2014

Ocean Shores Real Estate ~ First Quarter 2014 Review‏

New post on Ocean Shores Real Estate Broker

Ocean Shores Real Estate ~ First Quarter 2014 Review

by jeffgd
 
 Image
Greetings from the beach...
2014 is off to a great start following last year - which was the first "up" year that we've seen out here in a long time. Home sales are up as well as average prices. Same goes with vacant lots. Even commercial sales are going well. The real estate market here is getting better, but we've still got a long way to go before I'll call it good.
  
 Image
Ocean Shores Residential SalesThe Ocean Shores residential real estate market increased over 36% from 1st quarter 2014 versus the same quarter in 2013. That's awesome news. 52 homes sold compared to only 38 in 2013. This has been the strongest 1st quarter that we've seen at the beach in a long time. Home prices increased a little over 5.6% this past quarter as well from the previous quarter in 2013. The average home sale was $156,384. The most expensive home to sell so far this year was $385,000 which was a very nice, newer bay front home. Home inventory is down over 16% from last year which is also very good news. Just over 13% of our home sales were foreclosures this past quarter compared to 18% in 2013. This number should be in the single digits next quarter as there are only 21 foreclosures on the market today in Ocean Shores.2014 Home Sales (so far)The average home that sold during 1st quarter in Ocean Shores was 1,498 square feet and took 241 days to sell compared to 1,475 square feet and 242 days in 2013. There are only 217 homes on the market right now compared to 259 at this time last year. This is an inventory decline of over 16% ~ Average list price: $210,447 ~ Average of 274 days on market. One has been for sale for 3,165 days now (that’s almost 9 years for this same house that's in this report every quarter...) - not my listing... There were 35 Homes pending on April 1st compared to 27 on January 1st, 2014.2014 Quarterly Home Sales* 52 Homes Sold during 1st Quarter 2014 ~ Average Sales Price $156,384 ~ Average of 241 Days on Market. Price Range: $23,000 - $385,000.
* 49 Homes Sold during 4th Quarter 2013 ~ Average Sales Price: $153,136 ~ Average of 217 Days on Market. Price Range: $25,000 - $347,000.
* 70 Homes Sold during 3rd Quarter 2013 ~ Average Sales Price $141,161 ~ Average of 224 Days on Market. Price Range: $27,500 - $300,000.
* 42 Homes Sold during 2nd Quarter 2013 ~ Average Sales Price $151,355 ~ Average of 236 Days on Market. Price Range: $27,000 - $327,000.
* 38 Homes Sold during 1st Quarter 2013 ~ Average Sales Price $148,002 ~ Average of 316 Days on Market. Price Range: $25,000 - $385,000.
  Image

 
Want to know what's going on in the Ocean Shores Real Estate market more than once a quarter? Be a Fan & "Like" us at http://www.facebook.com/pages/Ocean-Shores-Real-Estate/42604953991. Thanks! By the way, the contents of this newsletter were posted on the Facebook page before you got this...
Ocean Shores Condo SalesFour Condos sold during 1st quarter compared to five in the same quarter during 2013. Condo inventory and prices are way down. The most expensive condo on the market right now is $164,900. There are only a few Ocean View condos available.
2014 Condo Sales (so far)The average condo that sold last quarter in Ocean Shores was 807 square feet and took 161 days to sell. One of the four sold was a foreclosure. There are only 27 condos on the market (29 last year at this time) for an average list price of $102,098 (compared to $92,755 last year). One condo is currently pending and listed at $125,000.
2014 Quarterly Condo Sales
* 4 Condos Sold during 1st Quarter 2014 ~ Average Sales Price: $98,625 ~ Average of 161 Days on Market. Price Range: $28,000 - $180,000.
* 1 Condo Sold during 4th Quarter 2013 ~ Sales Price: $130,000 ~ 166 Days on Market.
* 8 Condos Sold during 3rd Quarter 2013 ~ Average Sales Price: $132,488 ~ Average of 352 Days on Market. Price Range: $32,000 - $287,000.
* 5 Condos Sold during 2nd Quarter 2013 ~ Average Sales Price: $125,590 ~ Average of 225 Days on Market. Price Range: $50,000 - $215,000.
* 5 Condos Sold during 1st Quarter 2013 ~ Average Sales Price: $104,580 ~ Average of 357 Days on Market. Price Range: $27,900 - $185,000.


Ocean Shores Vacant Lot SalesVacant land sales increased a bit this past quarter compared to the same quarter in 2013. The number of sales increased from 29 to 35 (increase of 20%) this year while the average price went up just a few hundred dollars. Sixteen of the 35 lots sold were sold for $10,000 or less. There are only 61 (64 last year) lots listed for $10,000 or less currently…
2014 Vacant Lot Sales (so far)There are 440 (441 last year) lots on the market right now for an average list price of $48,171 ($44,946 last year). There are 14 (16 last year) lots currently pending. It took 367 days to sell a vacant lot compared to 313 days in 2013.
2014 Quarterly Vacant Lot Sales* 35 Lots Sold during 1st Quarter 2014 ~ Average Sales Price: $22,732 ~ Average of 367 Days on Market. Price Range: $3.000 - $140,000.
* 41 Lots Sold during 4th Quarter 2013 ~ Average Sales Price: $15,495 ~ Average of 318 Days on Market. Price Range: $800 - $50,000.
* 53 Lots Sold during 3rd Quarter 2013 ~ Average Sales Price: $22,517 ~ Average of 378 Days on Market. Price Range: $5,000 - $150,000.
* 53 Lots Sold during 2nd Quarter 2013 ~ Average Sales Price: $18,597 ~ Average of 247 Days on Market. Price Range: $5,000 - $85,000.
* 29 Lots Sold during 1st Quarter 2013 ~ Average Sales Price: $22,266 ~ Average of 312 Days on Market. Price Range: $5,500 - $63,500.
Image
cityofoceanshores.com Update
www.cityofoceanshores.com has been completely overhauled, update and is pretty cool. Please check it out. Thank you!
Image
Upcoming Things to Do in Ocean Shores
Click the picture for something to do every day in Ocean Shores & Grays Harbor
 
Life's @ the Beach!
 
Jeff Daniel                  Managing Broker
John L. Scott Ocean Shores
Cell Phone: 360.581.9020711 Point Brown Ave NW
Ocean Shores, WA 98569
360.289.2454 (fax)
 
This message (including attachment if any) is confidential and may be privileged. If you have received this message by mistake please notify the sender by return e-mail and delete this message from your system. Any unauthorized use or dissemination of this message in whole or in part is strictly prohibited. All real estate data is taken from the NWMLS.com website.
jeffgd | April 12, 2014 at 4:13 pm | Tags: Ocean Shores Washington Real Estate | Categories:Uncategorized | URL: http://wp.me/p2gGaa-18
Comment   See all comments   Like
Unsubscribe to no longer receive posts from Ocean Shores Real Estate Broker.
Change your email settings at Manage Subscriptions.

Sunday, January 12, 2014

Ocean Shores Real Estate ~ 2013 Year in Review‏


Ocean Shores Real Estate ~ 2013 Year in Review


CaptureGreetings from the beach…
Another year has passed at the beach and the real estate market has made some great strides. 2013 is the first year since 2005 in Ocean Shores where home prices and home sales both increased. Our third quarter sales were huge with 70 homes selling over the summer. I don’t remember a quarter being that strong since 2006. Condo and home sales made small gains, but were both up as well. Overall, it was a very good year for the Ocean Shores Real Estate Market.
About OS
Ocean Shores Residential Sales
The Ocean Shores residential real estate market increased nearly 18% in 2013 compared to sales back in 2012. 199 homes sold. We haven’t seen this many residential sales since 2008 when we sold 201 homes. Home prices increased a little over 6.1% this past year as well as the average home sale was $147,568. The most expensive home to sell in 2013 was an ocean front that sold for $385,000 thank you very much.
Just over 18% of our home sales were foreclosures in 2013. That number was 26% last year, so it’s good that this number keeps falling. The other good news for now though is that only 17 out of the 195 homes on the market today are foreclosures or just 8.7%.  Hopefully that number is zero percent next year.
2013 Home Sales
The average home that sold last year in Ocean Shores was 1,475 square feet and took 242 days to sell compared to 1,422 square feet and 204 days in 2012. There are only 195 homes on the market right now ~ Average list price: $195,900 (it was $188,161 last year at this time) ~ Average of 303 Days on Market. One has been on the market for 3,072 days now (that’s over 8 years!) and thank God that it’s not my listing… There were 27 Homes pending on January 1st… ~ Average list price of those: $192,102 (it was only $154,113 last year).
OS Annual Home Sales
* 199 Homes sold in 2013 for an average sales price of $147,568 (cheapest was $25,000 – most expensive was $385,000).
* 169 Homes sold in 2012 for an average sales price of $138,995 (cheapest was $12,000 – most expensive was $580,000).
* 169 Homes sold in 2011 for an average sales price of $143,192 (cheapest was $32,905 – most expensive was $405,000).
* 179 Homes sold in 2010 for an average sales price of $170,724 (cheapest was $28,000 – most expensive was $520,000).
2013 Quarterly Home Sales
* 49 Homes Sold during 4th Quarter 2013 ~ Average Sales Price: $153,136 ~ Average of 217 Days on Market. Price Range: $25,000 – $347,000.
* 70 Homes Sold during 3rd Quarter 2013 ~ Average Sales Price $141,161 ~ Average of 224 Days on Market. Price Range: $27,500 – $300,000.
* 42 Homes Sold during 2nd Quarter 2013 ~ Average Sales Price $151,355 ~ Average of 236 Days on Market. Price Range: $27,000 – $327,000.
* 38 Homes Sold during 1st Quarter 2013 ~ Average Sales Price $148,002 ~ Average of 316 Days on Market. Price Range: $25,000 – $385,000.filename_02
Want to know what’s going on in the Ocean Shores Real Estate market more than once a quarter? Be a Fan & “Like” us at http://www.facebook.com/pages/Ocean-Shores-Real-Estate/42604953991. Thanks! By the way, the contents of this newsletter were posted on the Facebook page before you got this…
Ocean Shores Condo Sales
2013 was another decent year for condo sales in Ocean Shores and like residential sales – they were up. 19 Condos sold last year up from 17 last year. Condo inventory and prices are way down. The most expensive condo on the market right now is $164,900. There are only a few Ocean View condos available. Most of the available condos on the market right now are “condotels.” Those places don’t allow for normal, full-time usage so sales are quite bleak for them. Hopefully, some condotels will sell soon.
2013 Condo Sales
The average condo that sold last year in Ocean Shores was 972 square feet and took 310 days to sell compared to 920 square feet and 401 days in 2012. Four out of the 19 condos sold were foreclosures. There are only 29 condos on the market (39 last year at this time) for an average list price of $92,755 (compared to $122,894 last year). There are zero condos pending currently – same as last year.
OS Annual Condo Sales 
* 19 Condos sold in 2013 for an average sales price of $123,197 (cheapest was $27,900 – most expensive was $287,000).
* 17 Condos sold in 2012 for an average sales price of $107,191 (cheapest was $25,000 – most expensive was $215,000).
* 17 Condos sold in 2011 for an average sales price of $141,906 (cheapest was $5,000 (time share) – most expensive was $224,900).
* 17 Condos sold in 2010 for an average sales price of $111,965 (cheapest was $25,000 – most expensive was $259,000).
2013 Quarterly Condo Sales
* 1 Condo Sold during 4th Quarter 2013 ~ Sales Price: $130,000 ~ 166 Days on Market.
* 8 Condos Sold during 3rd Quarter 2013 ~ Average Sales Price: $132,488 ~ Average of 352 Days on Market. Price Range: $32,000 – $287,000.
* 5 Condos Sold during 2nd Quarter 2013 ~ Average Sales Price: $125,590 ~ Average of 225 Days on Market. Price Range: $50,000 – $215,000.
* 5 Condos Sold during 1st Quarter 2013 ~ Average Sales Price: $104,580 ~ Average of 357 Days on Market. Price Range: $27,900 – $185,000.
JeffDaniel.EmailBanner
Ocean Shores Vacant Lot Sales
Vacant land sales increased a little bit this past year at the beach. In fact, there haven’t been this many lot sales in Ocean Shores since 2008 (189 sales). The constant challenge of getting buyers to assume the Street LID or getting sellers to pay it off is still a challenge in obtaining sales but it’s starting to get better. Like last year, a lot of sellers dropped their prices to unload these lots to really low prices which did motivate numerous buyers to take advantage of the cheap pricing. 78 (62 last year) of the 167 lots sold this year sold for $10,000 or less… There are only 64 (45 last year) lots listed for $10,000 or less currently… I fully expect the days of getting a lot in Ocean Shores for under $10,000 to end soon.
2013 Vacant Lot Sales
There are 441 (392 last year) lots on the market right now for an average list price of $44,946 ($44,675 last year). There are 16 (8 last year) lots currently pending for an average list price of $36,575. It took 313 days to sell a vacant lot in 2013 compared to 388 days in 2012. One lot took 2,572 days to sell…
OS Annual Lot Sales 
* 176 Lots sold in 2013 for an average sales price of $19,659 (cheapest was $800 – most expensive was $150,000).
* 167 Lots sold in 2012 for an average sales price of $21,237 (cheapest was $4,000 – most expensive was $95,000).
* 136 Lots sold in 2011 for an average sales price of $27,987 (cheapest was $4,999 – most expensive was $175,000).
* 159 Lots sold in 2010 for an average sales price of $27,953 (cheapest was $5,000 – most expensive was $179,500).
2013 Quarterly Vacant Lot Sales
* 41 Lots Sold during 4th Quarter 2013 ~ Average Sales Price: $15,495 ~ Average of 318 Days on Market. Price Range: $800 – $50,000.
* 53 Lots Sold during 3rd Quarter 2013 ~ Average Sales Price: $22,517 ~ Average of 378 Days on Market. Price Range: $5,000 – $150,000.
* 53 Lots Sold during 2nd Quarter 2013 ~ Average Sales Price: $18,597 ~ Average of 247 Days on Market. Price Range: $5,000 – $85,000.
* 29 Lots Sold during 1st Quarter 2013 ~ Average Sales Price: $22,266 ~ Average of 312 Days on Market. Price Range: $5,500 – $63,500.
2013 Multifamily Sales
Only One Multifamily buildings sold in Ocean Shores in 2013 compared to five last year. Multifamily property sales are obviously very slow right now.
2013 Commercial Property Sales
Five Commercial buildings sold in 2013 which was the same as 2012. Three sold in 2011 and two in 2010. Average price was $359,900 compared to $136,360 in 2012.
Copy of The North Beach (2) (1)
Total Real Estate Sales for all of Grays Harbor
2013 – 1124 Transactions with a total volume of $116,657,672.
2012 – 1004 Transactions with a total volume of $101,896,506.
2011 – 1038 Transactions with a total volume of $112,102,309.
2010 – 987 Transactions with a total volume of $115,558,046.
Harbor Home Sales
770 Homes sold in Grays Harbor County in 2013. Average price: $126,023.
673 Homes sold in Grays Harbor County in 2012. Average price: $122,038.
695 Homes sold in Grays Harbor County in 2011. Average price: $134,342.
652 Homes sold in Grays Harbor County in 2010. Average price: $145,991.
Harbor Home Sales Summary
Ocean Shores – 199 (up 30) Homes sold for an average price of $147,568.
Aberdeen – 167 (up 6) Homes sold for an average price of $94,755.
Hoquiam – 93 (up 8) Homes sold for an average price of $79,790.
Elma – 78 (up 15) Homes sold for an average price of $165,965.
Montesano – 78 (up 15) Homes sold for an average price of $147,624.
Westport – 43 (up 8) Homes sold for an average price of $124,979.
McCleary – 29 (up 1) Homes sold for an average price of $102,793.
Cosmopolis – 17 (up 1) Homes sold for an average price of $110,058.
Grayland – 14 (up 5) Homes sold for an average price of $122,221.
Pacific Beach – 11 (down 1) Homes sold for an average price of $295,324.
Oakville – 10 (up 4) Homes sold for an average price of $152,641.
Copalis Beach – 7 (up 4) Homes sold for an average price of $103,857.
Ocean City – 7 Homes sold for an average price of $148,286.
Moclips – 2 (down 4) Homes sold for an average price of $110,000.
Harbor Condo Sales   
34 Condos sold in Grays Harbor County in 2013. Average price: $155,346.
31 Condos sold in Grays Harbor County in 2012. Average price: $129,226.
31 Condos sold in Grays Harbor County in 2011. Average price: $137,858.
41 Condos sold in Grays Harbor County in 2010. Average price: $124,232.
Ocean Shores vs Westport Condo Sales
Westport – 13 (15 in 2012) Condos sold in 2013: Average price: $215,923.
Ocean Shores – 19 (17 in 2012) Condos sold in 2013. Average price: $123,197.
Harbor Vacant Lot Sales
276 Vacant Lots sold in Grays Harbor County in 2013. Average price: $39,403.
258 Vacant Lots sold in Grays Harbor County in 2012. Average price: $37,583.
263 Vacant Lots sold in Grays Harbor County in 2011. Average price: $43,800.
240 Vacant Lots sold in Grays Harbor County in 2010. Average price: $43,099.
Harbor Vacant Lot Sales Summary
Ocean Shores – 176 (up 9) Lots sold
Aberdeen – 13 (down 9) Lots sold
Westport – 13 (up 2) Lots sold
Copalis Beach – 11 (up 6) Lots sold
Elma – 10 (up 1) Lots sold
Montesano – 10 (up 5) Lots sold
Grayland – 9 (up 3) Lots sold
Hoquiam – 7 (flat) Lots sold
Pacific Beach – 6 (down 1) Lots sold
Moclips – 5 (up 3) Lots sold
McCleary – 3 (down 4) Lots sold
Ocean City – 3 (up 2) Lots sold
When it's time to sell or buy
Washington Coastal Community Comparisons
Residential sales on Washington’s coast were up quite a bit in all areas except the North Beach (Seabrook/Moclips) area. The Long Beach/Ocean Park area in Pacific County saw the number of home sales in their market jump nearly 25%. Below is a comparison of the four major coastal areas in Washington State.
Ocean Shores / Ocean City
* 207 Homes sold in 2013 for an average sales price of $147,396. Total volume was $30,510,942 up from $23,705,239 in 2012.
* 171 Homes sold in 2012 for an average sales price of $138,627. Total volume was $23,705,239.
* 171 Homes sold in 2011 for an average sales price of $143,482. Total volume was $24,535,361.
* 181 Homes sold in 2010 for an average sales price of $169,776. Total volume was $30,726,526.
Long Beach / Ocean Park
* 208 Homes sold in 2013 for an average sales price of $137,076. Total volume was $28,511,861 up from $18,726,719 in 2012.
* 156 Homes sold in 2012 for an average sales price of $120,043. Total volume was $18,726,719.
* 133 Homes sold in 2011 for an average sales price of $149,703. Total volume was $19,910,500.
* 150 Homes sold in 2010 for an average sales price of $161,531. Total volume was $24,229,648.
Westport / Grayland
* 59 Homes sold in 2013 for an average sales price of $122,631. Total volume was $7,234,200 up from $5,605,763 in 2012.
* 44 Homes sold in 2012 for an average sales price of $127,404. Total volume was $5,605,763.
* 62 Homes sold in 2011 for an average sales price of $126,160. Total volume was $7,821,944.
* 42 Homes sold in 2010 for an average sales price of $133,945. Total volume was $5,625,700.
Seabrook / Copalis Beach / Moclips / Pacific Beach
* 20 Homes sold in 2013 for an average sales price of $209,778. Total volume was $4,195,565 up from $4,010,653 in 2012.
* 21 Homes sold in 2012 for an average sales price of $190,983. Total volume was $4,010,653.
* 34 Homes sold in 2011 for an average sales price of $269,781. Total volume was $9,172,538.
* 23 Homes sold in 2010 for an average sales price of $273,591. Total volume was $6,292,590.
What is my home worth
Thanks for another great year!
I really need to thank all of my patient sellers & buyers along with all the great real estate agents, lenders, escrow & title folks and anyone else that I worked with in 2013 to make it another great year for me in real estate! This year I finished again at the top of the list with nearly 14% of all the real estate sales in Ocean Shores. I was also tops in Grays Harbor County. This has been my second full year at John L. Scott and I still can’t tell you what a great office, company and atmosphere we have. Additionally, the johnlscott.com website and the John L. Scott app are great! John L. Scott is the top-producing brokerage in Ocean Shores with the most brokers, listings and sales. The office did over 36% of all the real estate business in town last year (up from 34% in 2012). Thank you!
 2013 Ocean Shores Real Estate Brokerage Rankings
John L. Scott – 36%
Windermere – 20%
Premier Realty – 10%
Laurie Christian – 7%
Coldwell Banker – 6%
Ocean Beach Properties – 2%
cityofoceanshores.com Update
www.cityofoceanshores.com has been completely overhauled, update and is pretty cool. Please check it out. Thank you!
Upcoming Things to Do in Ocean Shores
filename_01
Life’s @ the Beach!
Jeff Daniel              
Managing Broker
John L. Scott Ocean Shores
Cell Phone: 360.581.9020711 Point Brown Ave NW
Ocean Shores, WA 98569
360.289.2454 (fax)
This message (including attachment if any) is confidential and may be privileged. If you have received this message by mistake please notify the sender by return e-mail and delete this message from your system. Any unauthorized use or dissemination of this message in whole or in part is strictly prohibited. All real estate data is taken from the NWMLS.com website.