
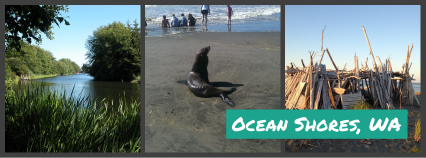
Ocean Shores Real Estate ~ 2014 Year in Review
 Greetings from the beach…
Another year has passed at the beach and the real estate market continues to make great strides. 2014 is the second year in a row since 2005 in Ocean Shores where home prices and home sales both increased. Vacant lot sales and prices (barely) were up as well. Condo sales slipped a little while both multifamily and commercial sales were up. Overall, it was another good, solid year for the Ocean Shores Real Estate Market.
Ocean Shores Residential Sales
Ocean Shores residential sales increased over 24% in 2014 compared to sales back in 2013. 247 homes sold last year up from 199 in 2013. We haven’t seen this many residential sales since 2006 when 256 homes sold. Home prices increased a little over 3.1% this past year as the average home price was $152,257. The most expensive home to sell in 2014 was an ocean front that fetched $565,000. Just over 18% of our home sales were foreclosures in 2014. That number was the same in 2013. The good news for now though is that only 17 out of the 184 homes on the market today are foreclosures or 9.2%. This number has to dramatically come down for home values to start showing significant gains out here on the beach.
2014 Home Sales
The average home that sold last year in Ocean Shores was 1,438 square feet and took 229 days to sell compared to 1,475 square feet and 242 days in 2013. 40 homes sold in 30 days or less. One house took 1,936 days to sell… There are only 184 homes on the market right now and 11 of those are presales meaning that they don’t actually exist… yet ~ Average list price: $206,775 (it was $195,900 last year at this time) ~ Average of 286 Days on Market. One has been on the market for 3,436 days now (that’s almost 10 years!) and no, it’s not my listing. That seller, however, has reduced his price (but probably not enough…) There were 23 Homes pending on January 1st… ~ Average list price of those: $150,483.OS Annual Home Sales* 247 Homes sold in 2014 for an average sales price of $152,257 (cheapest was $17,000– most expensive was $565,000).
* 199 Homes sold in 2013 for an average sales price of $147,568 (cheapest was $25,000 – most expensive was $385,000).
* 169 Homes sold in 2012 for an average sales price of $138,995 (cheapest was $12,000 – most expensive was $580,000).
* 169 Homes sold in 2011 for an average sales price of $143,192 (cheapest was $32,905 – most expensive was $405,000).
2014 Quarterly Home Sales
* 54 Homes Sold during 4th Quarter 2014 ~ Average Sales Price: $170,990 ~ Average of 196 Days on Market. Price Range: $17,000 – $565,000.
* 76 Homes Sold during 3rd Quarter 2014 ~ Average Sales Price: $142,752 ~ Average of 202 Days on Market. Price Range: $20,000 – $395,000.
* 65 Homes Sold during 2nd Quarter 2014 ~ Average Sales Price: $145,274 ~ Average of 285 Days on Market. Price Range: $30,000 – $368,950.
* 52 Homes Sold during 1st Quarter 2014 ~ Average Sales Price: $156,384 ~ Average of 241 Days on Market. Price Range: $23,000 – $385,000.
* 49 Homes Sold during 4th Quarter 2013 ~ Average Sales Price: $153,136 ~ Average of 217 Days on Market. Price Range: $25,000 – $347,000.

Want to know what’s going on in the Ocean Shores Real Estate market more than once a quarter? Be a Fan & “Like” us at http://www.facebook.com/pages/Ocean-Shores-Real-Estate/42604953991. Thanks! By the way, the contents of this newsletter were posted on the Facebook page before you got this…
Ocean Shores Condo Sales
2014 was an okay year for condo sales in Ocean Shores. 17 Condos sold – down from 19 in 2013. Condo inventory is the same as last year as well while list prices are up. All of the really lower-priced condos and foreclosures have pretty much sold. The most expensive condo on the market right now is $269,000 and it’s a gorgeous renovated ocean front next to the North Jetty. There are only a few Ocean View/Ocean Front condos available. Most of the available condos on the market right now are “condotels” – such as the Canterbury, Grey Gull, Polynesian, etc. No condotels sold last year. Hopefully, some of them will sell in 2015. Prices are very good for them historically speaking.
2014 was an okay year for condo sales in Ocean Shores. 17 Condos sold – down from 19 in 2013. Condo inventory is the same as last year as well while list prices are up. All of the really lower-priced condos and foreclosures have pretty much sold. The most expensive condo on the market right now is $269,000 and it’s a gorgeous renovated ocean front next to the North Jetty. There are only a few Ocean View/Ocean Front condos available. Most of the available condos on the market right now are “condotels” – such as the Canterbury, Grey Gull, Polynesian, etc. No condotels sold last year. Hopefully, some of them will sell in 2015. Prices are very good for them historically speaking.
2014 Condo Sales
The average condo that sold last year in Ocean Shores was 886 square feet and took 246 days to sell compared to 972 square feet and 310 days in 2012. Four out of the 17 sold were foreclosures. There are only 29 condos on the market (same as last year) for an average list price of $114,882 (compared to $92,755 last year). One condo is pending currently and it’s listed for $49,500.
The average condo that sold last year in Ocean Shores was 886 square feet and took 246 days to sell compared to 972 square feet and 310 days in 2012. Four out of the 17 sold were foreclosures. There are only 29 condos on the market (same as last year) for an average list price of $114,882 (compared to $92,755 last year). One condo is pending currently and it’s listed for $49,500.
OS Annual Condo Sales
* 17 Condos sold in 2014 for an average sales price of $84,876 (cheapest was $15,000 – most expensive was $180,000).
* 19 Condos sold in 2013 for an average sales price of $123,197 (cheapest was $27,900 – most expensive was $287,000).
* 17 Condos sold in 2012 for an average sales price of $107,191 (cheapest was $25,000 – most expensive was $215,000).
* 17 Condos sold in 2011 for an average sales price of $141,906 (cheapest was $5,000 (time share) – most expensive was $224,900).
2014 Quarterly Condo Sales
* 7 Condo Sold during 4th Quarter 2014 ~ Average Sales Price: $67,071 ~ 259 Days on Market. Price Range: $15,000 – $127,000.
* 4 Condos Sold during 3rd Quarter 2014 ~ Average Sales Price: $127,225 ~ Average of 353 Days on Market. Price Range: $85,000 – $172,500.
* 2 Condos Sold during 2nd Quarter 2014 ~ Average Sales Price: $35,000 ~ Average of 154 Days on Market. Price Range: $20,000 – $50,000.
* 4 Condos Sold during 1st Quarter 2014 ~ Average Sales Price: $98,625 ~ Average of 161 Days on Market. Price Range: $28,000 – $180,000.
* 1 Condo Sold during 4th Quarter 2013 ~ Sales Price: $130,000 ~ 166 Days on Market.
 Ocean Shores Vacant Lot Sales
Vacant land sales increased 8.5% this past year at the beach. In fact, there haven’t been this many lot sales in Ocean Shores since 2007. The continuing challenge of getting buyers to assume the Street LID or getting sellers to pay off the LID, however, is still challenging but improving. Like last year, a lot of sellers dropped their prices to unload these lots to really low prices which did motivate numerous buyers to take advantage of the cheap pricing. Seventy-seven (78 last year) of the 191 lots sold this year for $10,000 or less… Nearly 100 city-owned foreclosure lots came on the market this year and eventually another hundred or so will go online in 2015 or so. If you would like a copy of the lot foreclosure list, feel free to respond to this and I’ll email it to you. Inventory is up 22.6% and until this number goes down, prices will likely remain flat. There are 89 (64 last year) lots listed for $10,000 or less presently…
2014 Vacant Lot Sales
There are 541 (441 last year) lots on the market right now for an average list price of $39,202 ($44,946 last year). There are 12 (16 last year at this time) lots currently pending for an average list price of $16,550. It took 283 days to sell a vacant lot in 2014 compared to 313 days in the year before. One lot took 2,598 days to sell…
OS Annual Lot Sales
* 191 Lots sold in 2014 for an average sales price of $19,971 (cheapest was $3,000 – most expensive was $260,000).
* 176 Lots sold in 2013 for an average sales price of $19,659 (cheapest was $800 – most expensive was $150,000).
* 167 Lots sold in 2012 for an average sales price of $21,237 (cheapest was $4,000 – most expensive was $95,000).
* 136 Lots sold in 2011 for an average sales price of $27,987 (cheapest was $4,999 – most expensive was $175,000).
2014 Quarterly Vacant Lot Sales
* 43 Lots Sold during 4th Quarter 2014 ~ Average Sales Price: $18,867 ~ Average of 296 Days on Market. Price Range: $4,500 – $66,000.
* 69 Lots Sold during 3rd Quarter 2014 ~ Average Sales Price: $16,307 ~ Average of 259 Days on Market. Price Range: $4,000 – $78,000.
* 44 Lots Sold during 2nd Quarter 2014 ~ Average Sales Price: $25,127 ~ Average of 227 Days on Market. Price Range: $3,000 – $265,000 (a triple lot on the water).
* 35 Lots Sold during 1st Quarter 2014 ~ Average Sales Price: $22,732 ~ Average of 367 Days on Market. Price Range: $3,000 – $140,000.
* 41 Lots Sold during 4th Quarter 2013 ~ Average Sales Price: $15,495 ~ Average of 318 Days on Market. Price Range: $800 – $50,000.
 2014 Multifamily Sales
Four Multifamily buildings sold in Ocean Shores last year compared to only one in 2013. Three of the apartments that sold were foreclosures. Average sales price was $203,125. Average square footage was 4,331.
2014 Commercial Property Sales
Eight Commercial buildings sold in 2014 compared to five in 2013. Price Range: $69,000 – $1,148,000.
Eight Commercial buildings sold in 2014 compared to five in 2013. Price Range: $69,000 – $1,148,000.
Total Real Estate Sales for all of Grays Harbor
2014 – 1274 Transactions with a total volume of $140,112,276.
2013 – 1124 Transactions with a total volume of $116,657,672.
2012 – 1004 Transactions with a total volume of $101,896,506.
2011 – 1038 Transactions with a total volume of $112,102,309.
2014 – 1274 Transactions with a total volume of $140,112,276.
2013 – 1124 Transactions with a total volume of $116,657,672.
2012 – 1004 Transactions with a total volume of $101,896,506.
2011 – 1038 Transactions with a total volume of $112,102,309.
Harbor Home Sales
912 Homes sold in Grays Harbor County in 2014. Average price: $134,410.
770 Homes sold in Grays Harbor County in 2013. Average price: $126,023.
673 Homes sold in Grays Harbor County in 2012. Average price: $122,038.
695 Homes sold in Grays Harbor County in 2011. Average price: $134,342.
Harbor Home Sales Summary
Ocean Shores – 247 (up 48) Homes sold for an average price of $152,257.
Aberdeen – 203 (up 37) Homes sold for an average price of $96,761.
Hoquiam – 116 (up 23) Homes sold for an average price of $80,135.
Montesano – 82 (up 4) Homes sold for an average price of $159,195.
Elma – 74 (down 4) Homes sold for an average price of $165,257.
Westport – 47 (up 4) Homes sold for an average price of $133,435.
McCleary – 41 (up 12) Homes sold for an average price of $131,854.
Oakville – 26 (up 16) Homes sold for an average price of $152,360.
Pacific Beach/Seabrook – 19 (up 8) Homes sold for an average price of $436,449.
Cosmopolis – 18 (up 1) Homes sold for an average price of $111,044.
Grayland – 18 (up 4) Homes sold for an average price of $118,331.
Copalis Beach – 10 (up 3) Homes sold for an average price of $145,162.
Ocean City – 1 (down 5) Homes sold for $143,000.
Moclips – 0 (down 1) Homes sold for an average price of $0.
Harbor Condo Sales
37 Condos sold in Grays Harbor County in 2014. Average price: $108,086.
34 Condos sold in Grays Harbor County in 2013. Average price: $155,346.
31 Condos sold in Grays Harbor County in 2012. Average price: $129,226.
31 Condos sold in Grays Harbor County in 2011. Average price: $137,858.
Ocean Shores vs Westport Condo Sales
Westport – 19 (up 6) Condos sold in 2014: Average price: $130,858.
Ocean Shores – 17 (down 2) Condos sold in 2014. Average price: $84,876.
Harbor Vacant Lot Sales
275 Vacant Lots sold in Grays Harbor County in 2014. Average price: $33,688.
276 Vacant Lots sold in Grays Harbor County in 2013. Average price: $39,403.
258 Vacant Lots sold in Grays Harbor County in 2012. Average price: $37,583.
263 Vacant Lots sold in Grays Harbor County in 2011. Average price: $43,800.
240 Vacant Lots sold in Grays Harbor County in 2010. Average price: $43,099.
Harbor Vacant Lot Sales Summary
Ocean Shores – 191 (up 15) Lots sold
Westport – 15 (up 2) Lots sold
Elma – 14 (up 4) Lots sold
Aberdeen – 12 (down 1) Lots sold
Montesano – 7 (down 3) Lots sold
Hoquiam – 6 (down 1) Lots sold
Taholah – 5 (up 4) Lots sold
Pacific Beach – 4 (down 2) Lots sold
Grayland – 4 (down 4) Lots sold
Copalis Beach – 3 (down 8) Lots sold
Moclips – 3 (down 2) Lots sold
Ocean City – 2 (down 1) Lots sold
Washington Coastal Community Comparisons
Residential sales on Washington’s coast were up quite a bit in all areas except that no homes sold in Moclips, while Seabrook and Copalis Beach were both up a little bit. All in all, the four main areas on the Washington Coast were all up sales transaction and sales volume. Below is a comparison of the four major coastal areas in Washington State:
Residential sales on Washington’s coast were up quite a bit in all areas except that no homes sold in Moclips, while Seabrook and Copalis Beach were both up a little bit. All in all, the four main areas on the Washington Coast were all up sales transaction and sales volume. Below is a comparison of the four major coastal areas in Washington State:
Ocean Shores / Ocean City
* 248 Homes sold in 2014 for an average sales price of $152,220. Total volume was $37,750,490 up nearly 24% from $30,510,942 in 2013.
* 207 Homes sold in 2013 for an average sales price of $147,396. Total volume was $30,510,942 up from $23,705,239 in 2012.
* 171 Homes sold in 2012 for an average sales price of $138,627. Total volume was $23,705,239.
* 171 Homes sold in 2011 for an average sales price of $143,482. Total volume was $24,535,361.
Long Beach / Ocean Park
* 228 Homes sold in 2014 for an average sales price of $159,185. Total volume was $36,294,131 up 27% from $28,511,861 in 2013.
* 208 Homes sold in 2013 for an average sales price of $137,076. Total volume was $28,511,861 up from $18,726,719 in 2012.
* 156 Homes sold in 2012 for an average sales price of $120,043. Total volume was $18,726,719.
* 133 Homes sold in 2011 for an average sales price of $149,703. Total volume was $19,910,500.
Westport / Grayland* 65 Homes sold in 2014 for an average sales price of $129,252. Total volume was $8,401,405 up 16% from $7,234,200 in 2013.
* 59 Homes sold in 2013 for an average sales price of $122,631. Total volume was $7,234,200 up from $5,605,763 in 2012.
* 44 Homes sold in 2012 for an average sales price of $127,404. Total volume was $5,605,763.
* 62 Homes sold in 2011 for an average sales price of $126,160. Total volume was $7,821,944.
Seabrook / Copalis Beach / Moclips / Pacific Beach* 29 Homes sold in 2014 for an average sales price of $336,005. Total volume was $9,744,141 up 132% from $4,195,565 in 2013.
* 20 Homes sold in 2013 for an average sales price of $209,778. Total volume was $4,195,565 up from $4,010,653 in 2012.
* 21 Homes sold in 2012 for an average sales price of $190,983. Total volume was $4,010,653.
* 34 Homes sold in 2011 for an average sales price of $269,781. Total volume was $9,172,538.

Thanks for another great year!
I really need to thank all of my patient sellers & buyers along with all the great real estate agents, lenders, escrow & title folks and anyone else that I worked with in 2014 to make it another great year for me in real estate! This year I finished again at the top of the list with nearly 14% of all the real estate sales in Ocean Shores. I was also tops in Grays Harbor County with 5% of the market. This has been my third year at John L. Scott and I still can’t tell you what a great office, company and atmosphere we have. Additionally, the johnlscott.com website and the John L. Scott app are great! John L. Scott is the top-producing brokerage in Ocean Shores with the most brokers, listings and sales – just over 35% of all the real estate business in Ocean Shores last year. Thank you!
I really need to thank all of my patient sellers & buyers along with all the great real estate agents, lenders, escrow & title folks and anyone else that I worked with in 2014 to make it another great year for me in real estate! This year I finished again at the top of the list with nearly 14% of all the real estate sales in Ocean Shores. I was also tops in Grays Harbor County with 5% of the market. This has been my third year at John L. Scott and I still can’t tell you what a great office, company and atmosphere we have. Additionally, the johnlscott.com website and the John L. Scott app are great! John L. Scott is the top-producing brokerage in Ocean Shores with the most brokers, listings and sales – just over 35% of all the real estate business in Ocean Shores last year. Thank you!
2014 Ocean Shores Real Estate Brokerage Rankings
John L. Scott – 35%
Windermere – 24%
Laurie Christian – 9%
Premier Realty – 5%
Coldwell Banker – 3%
North Beach – 3%
John L. Scott – 35%
Windermere – 24%
Laurie Christian – 9%
Premier Realty – 5%
Coldwell Banker – 3%
North Beach – 3%
cityofoceanshores.com Update
www.cityofoceanshores.com is updated and a sweet website to assist you in buying, living and enjoy Ocean Shores. Please check it out. Thank you!
www.cityofoceanshores.com is updated and a sweet website to assist you in buying, living and enjoy Ocean Shores. Please check it out. Thank you!
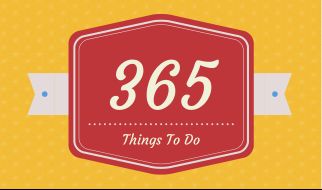
Upcoming Things to Do in Ocean Shores
Click the picture for something to do every day in Ocean Shores & Grays Harbor
Life’s @ the Beach!
Jeff Daniel
Managing Broker
Managing Broker
John L. Scott Ocean Shores
Cell Phone: 360.581.9020711 Point Brown Ave NW
Ocean Shores, WA 98569
360.289.2454 (fax)
This message (including attachment if any) is confidential and may be privileged. If you have received this message by mistake please notify the sender by return e-mail and delete this message from your system. Any unauthorized use or dissemination of this message in whole or in part is strictly prohibited. All real estate data is taken from the NWMLS.com website.